
Review Problems: Week 4
1. Political polling The polling firm Research 2000 interviewed 2,400 adults during the period September 14–17, 2009, on behalf of the Web site Daily Kos. The firm made a cross-section of calls into each state in the country in order to reflect the adult population nationally. Poll respondents were asked many different questions relating to politics in the United States. Answers to two of these questions ("Do you have a favorable or unfavorable opinion of President Barack Obama?" and "What region of the country do you live in?") are summarized in the following table:
Favorable Unfavorable No Opinion
Northeast 413 51 40
South 194 482 43
Midwest 403 201 46
West 311 179 37
a) Is this an observational study or an experiment? Explain.
b) Which of these might be considered an explanatory variable and which a response variable?
c) If we randomly select one of the people who were interviewed, what is the probability that the person
i) had an unfavorable opinion of Pres. Obama?
ii) was from the Midwest?
iii) had an unfavorable opinion of Pres. Obama, given he or she was from the Midwest?
iv) was from the Midwest, given he or she had an unfavorable opinion of Pres. Obama?
v) was from the Midwest and had an unfavorable opinion of Pres. Obama?
vi) was from the Midwest or had an unfavorable opinion of Pres. Obama?
d) Does opinion about the president appear to be independent of region? Explain, using conditional probabilities you computed above.
2. Exercise A statistics student wondered whether males spend more time exercising on a treadmill at the gym than females. She went to several different gyms on a single day in order to observe 20 males (denoted "m" below) and 20 females ("f") using a treadmill and record the time on the display when they finished running.
52 f 35 f 56 m 25 f
22 m 15 f 41 m 10 f
29 m 38 m 5 m 25 f
55 f 21 m 13 m 48 m
20 f 33 m 48 f 31 m
18 f 10 m 52 m 10 f
5 f 63 m 60 m 60 f
33 m 5 f 40 m 25 f
33 f 26 m 30 m 5 f
30 m 40 f 14 f 35 f
a) Was this an observational study or an experiment?
b) Was random sampling employed to select the participants? Explain.
c) If we randomly select one of the cases, compute the probability that the person selected:
i) was female.
ii) ran on the treadmill for more than half an hour.
iii) ran on the treadmill for more than half an hour, given that the person was female.
iv) was female, given that the person ran on the treadmill for more than half an hour.
v) was female or ran on the treadmill for more than half an hour.
vi) was female and ran on the treadmill for more than half an hour.
3. More exercise Refer to the data set from the previous problem. We wish to estimate the probability that, if we randomly select one male and one female from the cases in this data set, the selected male ran on the treadmill longer than the selected female. Devise a simulation to estimate this probability. Conduct 20 trials and use the results to estimate the probability in question. Explain how you generated your random numbers and include the random numbers for the first two or three trials to indicate how you conducted the simulation.
4. Toyota Prius The Prius is a popular gas-electric hybrid car manufactured by Toyota. The table below shows the VIN (vehicle identification number), color, age (in years), mileage (in miles) and asking price (in dollars) for 13 used Toyota Prius automobiles advertised for sale on the Web site of The Seattle Times on January 23, 2011.
VIN age color mileage price
JTDKN3DU9A0056349 1 black 9277 28995
JTDKN3DU8A0165157 1 black 4180 28995
JTDKN3DU1A0057303 1 blue 32105 25995
JTDKN3DU9A0147198 1 gray 8129 24995
JTDKB20U197821193 2 pewter 28434 23995
JTDKB20U683348798 3 green 40762 22995
JTDKB20U187716331 3 green 24531 22995
JTDKB20U387727363 3 blue 16262 22995
JTDKN3DU8A0059050 1 silver 32830 21995
JTDKB20U383347267 3 gray 32604 21995
JTDKB20U583417996 3 gray 43827 18995
JTDKB20U697840628 2 white 24632 20995
JTDKB20U297880205 2 white 33651 18680
a) Is this an observational study or an experiment?
b) If we randomly select one of these cars, compute the probability that we get
i) a gray Prius.
ii) a Prius with more than 10,000 miles.
iii) a Prius priced under $20,000
iv) a Prius priced under $20,000, given that the car is 2 years old.
v) a Prius at least 2 years old, given that the car is priced under $20,000.
vi) a Prius at most 2 years old, given that the car is priced over $20,000.
vii) a Prius that is 3 years old and has more than 20,000 miles.
viii) a Prius that is 3 years old or has more than 20,000 miles.
5. Caucuses Between November 30 and December 5, 2011, a New York Times/CBS News poll contacted 1,869 registered voters across the state of Iowa; 642 respondents said they would definitely or probably attend the Republican caucuses in January 2012. The survey asked each of the 642 likely Iowa caucus-goers who they planned to support for the Republican presidential nomination. The following table summarizes the responses of these 642 Iowans, along with results from a similar poll conducted in South Carolina by Winthrop University, which contacted 332 Republicans who will planned to participate in that state's presidential primary election the following month.
IA SC
Newt Gingrich 199 127
Mitt Romney 111 71
Ron Paul 103 14
other/undecided 229 120
a) Is this an observational study or an experiment?
b) Was randomness employed in the selection of the people polled?
c) If we randomly select one person who participated in the poll, compute the probability that the person:
i) supported Newt Gingrich?
ii) was from Iowa.
iii) was from Iowa, given that he or she supported Newt Gingrich.
iv) supported Newt Gingrich, given that he or she was from Iowa.
v) was from Iowa and supported Newt Gingrich.
vi) was from Iowa or supported Newt Gingrich.
d) Does candidate preference appear to be independent of state? Use conditional probabilities to explain your answer.
6. Fastballs Major League Baseball now records information about every pitch thrown in every game of every season. Statistician Jim Albert compiled data about every pitch thrown by 20 starting pitchers during the 2009 MLB season. The data set included the type of pitch thrown (curveball, changeup, slider, etc.) as well as the speed of the ball as it left the pitcher's hand. A histogram of speeds for all 30,740 four-seam fastballs thrown by these pitchers during the 2009 season is shown below, along with a Normal probability plot. The mean speed was 92.12 mph, with a standard deviation of 2.43 mph.

a) Was this data collected via an observational study or an experiment?
b) Looking at the histogram, do you think a Normal model applies to this data?
c) What does the Normal probability plot tell you about the appropriateness of a Normal model for this data?
d) Assuming that a Normal model does apply, compute the probability that a randomly selected fastball:
i) had a speed between 89 and 93 mph.
ii) had a speed in excess of 92 mph.
iii) had a speed below 87 mph or in excess of 92 mph.
iv) had a speed below 87 mph and in excess of 92 mph.
v) had a speed in excess of 92 mph, given that it traveled faster than 90 mph.
7. Exit polls To gather information about voting patterns in the 2008 U.S. presidential election, a group of newspapers and television networks hired Edison Media Research to conduct exit polls by surveying voters at polling locations nationwide on Election Day (November 4, 2008) in addition to conducting telephone interviews with voters who cast their ballot via absentee ballots or early voting. Among those surveyed were 1,241 voters from Washington State. The survey results included the candidate for whom each voter cast his or her ballot (Barack Obama, John McCain or someone else) and the voter's gender (male or female). The results of these two questions for the Washington voters appear in the table below.
Obama McCain other
male 340 238 18
female 374 250 21
a) Was this an observational study or an experiment?
b) If we randomly select one of these voters, what's the probability that:
i) he or she voted for McCain?
ii) she was female?
iii) she voted for McCain, given she was female?
iv) she was female, given she voted for McCain?
v) she was female and voted for McCain?
vi) she was female or voted for McCain?
c) Does there appear to have been a gender gap in Washington state during the 2008 presidential election? In other words, does gender appear to be independent of candidate? Use conditional probabilities to explain.
8. Side effects Spiriva is a drug designed to help people with diseases such as chronic bronchitis and emphysema. Clincal trials of Spiriva were conducted to determine possible side effects. Of 550 people randomly assigned to use Spiriva for one year, 226 developed an upper respiratory tract infection (URI). Of 371 people randomly assigned to use a placebo for one year, 137 developed a URI.
a) Was this an observational study or an experiment? Explain.
b) If we randomly select one of the study participants, compute the probability that this person:
i) used Spiriva.
ii) developed a URI.
iii) used Spiriva and developed a URI.
iv) used Spiriva or developed a URI.
v) developed a URI, given that they used Spiriva.
vi) developed a URI, given that they used a placebo.
vii) used Spiriva, given that they developed a URI.
c) Does it appear that people who take Spiriva are more likely to develop a URI than people who take placebo? Explain, using conditional probabilities.
9. Broadband use A survey by the Pew Internet and American Life Project asked a random sample of adults about use of the Internet. One question asked whether the subject had a broadband Internet connection at home. Another question asked about the type of community in which the subject lived (urban, suburban or rural). The results of these two questions are summarized in the following table:
Urban Suburban Rural
Yes 300 521 174
No 276 542 387
a) Was this an observational study or an experiment?
b) If we randomly select one of the people surveyed, compute the probability that they:
i) had a broadband Internet connection.
ii) lived in an urban area.
iii) had broadband access, given that they lived in an urban area.
iv) had broadband access, given that they lived in a rural area.
v) lived in an urban area, given that they had broadband access.
vi) lived in an urban area or had broadband access.
vii) lived in an urban area and had broadband access.
c) What can you conclude about a possible association between these variables? Use conditional probabilities to explain your answer.
10. Broadband again Refer to the data set from the previous problem.
a) If we randomly select one person who participated in the survey and lived in an urban area, another who lived in a suburban area and the a third who lived in a rural area, compute the probability that:
i) all three had broadband access.
ii) none had broadband access.
iii) at least one had broadband access.
iv) exactly one had broadband access.
b) If we randomly select survey participants until we find one who has broadband access, what is the probability that;
i) we only need to select one person?
ii) we only need to select two people?
iii) we only need to select three people?
iv) we need to select at most three people?
v) we need to select more than three people?
11. Paper airplanes For a class project, a student wanted to determine whether a paper airplane flew further, on average, with a paperclip attached to it. She used 30 similar pieces of papers, and folded each of them in the same manner, then attached a paperclip to the nose of 15 of them. On March 14, 2009, she flew each plane once, for a total of 30 flights. The following table shows the distance for each flight (in inches):
clip no clip
134 109
192 112
122 128
194 81
122 83
228 139
180 133
155 150
194 154
210 135
194 125
196 81
185 135
200 145
183 144
a) Was this an observational study or an experiment? Explain.
b) If we randomly select one plane from this data set, compute the probability that it:
i) had a paperclip.
ii) flew less than 100 feet.
iii) flew less than 100 feet, given that it had a paperclip.
iv) had a paperclip, given that it flew less than 100 feet.
v) had a paperclip or flew less than 100 feet.
vi) had a paperclip and flew less than 100 feet.
c) if we randomly select one plane with a paperclip and one without, compute the probability that both flew further than 150 feet.
12. Another flight Refer to the data set from the previous problem. If we randomly select one plane with a paperclip and one without, what is the probability that the plane with the paperclip flew further than the one without the paperclip? To estimate this probability, conduct a simulation with at least 20 runs. Carefully explain how you set up the simulation and include the random numbers you generated for the first two or three runs to demonstarte how you conducted the simulation.
13. Flu study In a study conducted during the 2007–2008 flu season ("Comparative Efficacy of Inactivated and Live Attenuated Influenza Vaccines," Arnold S. Monto, et al., New England Journal of Medicine, September 24 2009, 361:13, 1260–1267), 1,952 healthy adults were randomly assigned to receive a flu shot, FluMist (a nasal vaccine) or a placebo. Of the 813 volunteers receiving the flu shot, 28 later developed a confirmed case of influenza; in the FluMist group, 56 of the 814 volunteers developed the flu; and among the 325 patients who received a placebo, 35 developed the flu.
a) Was this an observational study or an experiment? Explain.
b) If we randomly select one participant, compute the probability that he or she:
i) used FluMist.
ii) developed the flu.
iii) developed the flu, given that they used FluMist.
iv) developed the flu, given that they received a flu shot.
v) developed the flu, given that they received a placebo.
vi) used FluMist, given that they developed the flu.
vii) used FluMist and developed the flu.
viii) used FluMist or developed the flu.
14. Left-hand turns On December 2, 2009, a statistics student observed traffic near the corner of 148th and Manor Way in Lynnwood, to investigate whether there is a difference in the duration of time taken to make a left-hand turn between male and female drivers. For 30 drivers (15 male and 15 female), she used a stopwatch to record the gender of each driver and the length of time used to make a left-hand turn. The data she recorded appears below:
male 4.0 3.4 4.3 3.6 2.7 3.8 4.3 3.5 5.3 4.6 3.9 5.1 5.0 4.1 4.8
female 4.7 5.3 5.4 4.1 4.7 3.8 3.1 4.2 4.1 2.9 4.1 4.2 3.7 4.0 4.0
a) Was this an observational study or an experiment? Explain.
b) If we randomly select one of these drivers, compute the probability that:
i) he or she took less than 5 seconds to make the turn.
ii) he was male.
iii) he took less than 5 seconds to make the turn, given that he was male.
iv) he was male, given that the took less than 5 seconds to make the turn.
v) he was male and took less than 5 seconds to make the turn.
vi) he was male or took less than 5 seconds to make the turn.
15. Another turn Refer to the data set from the previous problem. Conduct a simulation to estimate the probability that a randomly selected male driver took longer to make the turn than a randomly selected female driver.
16. Almond vs. dark chocolate A statistics student wondered whether the color distribution for Almond M&M's candies is the same as for Dark Chocolate Peanut M&M's. She collected several packages of each type and recorded the color of each candy, as summarized in the following table:
red orange yellow blue green brown
Almond 95 95 91 100 87 86
Dark Peanut 83 94 92 109 102 78
a) Was this an observational study or an experiment? Explain.
b) Compute the following probabilities:
i) P(almond)
ii) P(red)
iii) P(red|almond)
iv) P(almond|red)
v) P(almond or red)
vi) P(almond and red)
e) Do the color distributions appear to be the same or different? Explain, using conditional probabilities.
17. Liver disease Between 1974 and 1984, the Mayo Clinic collected information about patients with the liver disease primary biliary cirrhosis (PBC). A study of 216 of these patients with this disease found a mean serum albumin level of 34.46 g/l with a standard deviation of 5.84 g/l. A graphical display of these levels appears below:
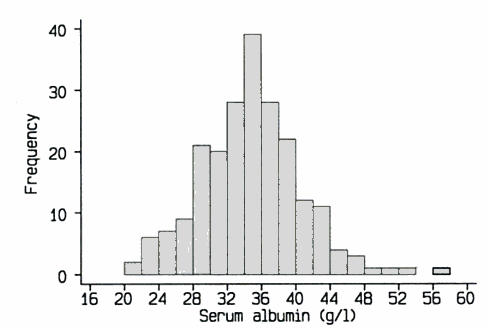
a) Do you think it is appropriate to use a Normal model for the serum albumin levels of PBC patients? Explain your answer using a complete sentence or two.
Now assume that a Normal model is appropriate, regardless of your answer to part a).
b) Compute the probability that a randomly selected PBC patients has a serum albumin level:
i) between 36 g/l and 45 g/l?
ii) below 36 g/l?
iii) above 45 g/l?
iv) below 36 g/l or above 45 g/l?
v) below 36 g/l and above 45 g/l?
18. Diet Coke and Mentos When Mentos candy is dropped into a bottle of Diet Coke, a reaction occurs, resulting in a geyser of Diet Coke shooting several feet into the air. A statistics student wondered if the temperature of the Diet Coke would affect the height of the Diet Coke geyser. She used 12 2-liter bottles of Diet Coke, 6 at room temperature and the 6 other refrigerated at 40°F. The height (in inches) of the resulting geyser for each of these 12 bottles appears in the table below.
room temp refrigerated
68 55
73 52
70 55
73 53
69 51
70 53
a) Was this an observational study or an experiment?
b) If we randomly select one of these bottles, compute the probability that:
i) it had a geyser higher than 70 inches.
ii) was refrigerated.
iii) was refrigerated, given that it had a geyser higher than 70 inches.
iv) had a geyser below 60 inches, given that it was refrigerated.
v) was refrigerated and had a geyser below 70 inches.
vi) was refrigerated or had a geyser below 70 inches.
c) If we randomly select one refrigerated bottle and one room-temperature bottle, compute the probability that the height of the geyser from the refrigerated bottle was higher than the height of the geyser from the room-temperature bottle.
19. Unions The Pew Research Center for the People & the Press sponsored a national survey to gather information about public opinion regarding labor unions and businesses. Interviewers at Princeton Data Source, under the direction of Princeton Survey Research Associates International, conducted telephone interviews during the period February 2–7, 2011, among a national sample of 1,385 adults 18 years of age or older living in the continental United States (952 respondents were interviewed on a landline telephone, while 433 were interviewed on a cell phone, including 197 who had no landline telephone). The interviewers called phone numbers taken from a combination of landline and cell phone random-digit–dial samples provided by Survey Sampling International. The survey asked the 1,385 participants about their opinion of labor unions (favorable, unfavorable or no opinion) and their political affiliation (Republican, independent, Democrat or other). The results from those two questions are summarized in the table below.
Republican independent Democrat other
favorable 102 215 273 29
unfavorable 190 235 123 21
no opinion 48 61 55 33
a) Was this an observational study or an experiment?
b) If we randomly select one of the people interviewed, compute the probability that:
i) the person was a Republican.
ii) the person was not a Democrat.
iii) the person had a favorable opinion about labor unions.
iv) the person had a favorable opinion about labor unions, given that he or she was a Republican.
v) the person was a Republican, given that he or she had a favorable opinion about labor unions.
vi) the person was a Republican and had a favorable opinion about labor unions.
vii) the person was a Republican or had a favorable opinion about labor unions.
c) If we randomly select one Republican and one Democrat, compute the probability that both had an unfavorable opinion about labor unions.
20. More unions Refer to the data set from the previous problem.
a) If we randomly select one of the people interviewed, compute the probability that:
i) the person was a Democrat.
ii) the person had an unfavorable opinion about labor unions.
iv) the person had an unfavorable opinion about labor unions, given that he or she was a Democrat.
v) the person was a Democrat, given that he or she had an unfavorable opinion about labor unions.
vi) the person was a Democrat or had an unfavorable opinion about labor unions.
vii) the person was a Democrat and had an unfavorable opinion about labor unions.
c) If we randomly select two of the people interviewed, compute the probability that:
i) both were Democrats.
ii) at least one was a Republican.
iii) neither had no opinion.
20. Unions again Refer to the data set from the previous two problems. Does party affiliation appear to be independent of opinion about labor unions? Explain, using conditional probabilities.
21. Last union problem Refer to the data set from the previous three problems.
a) If you randomly select five people from among those interviewed to participate in a follow-up survey, compute the probability that all of them are Democrats. Assume that once you call a person, you remove their name from your dialing list so that they are not selected twice.
b) Redo part a, but now assume that once you call a person, their name remains on your dialing list, so that it is possible a person is called more than once.
c) Compare your answers to parts a and b. Are they the same? Close? Explain.
d) If you randomly select five people from among those interviewed to participate in a follow-up survey, compute the probability that all of them have no opinion about labor unions.
e) What did you assume about the dialing process in part d?
f) Compute the answer to part d using a different assumption.
g) Compare your answers to parts d and f. Are they the same? Close? Explain.
22. Religion and politics To gather information about voting patterns in the 2012 U.S. presidential election, a group of newspapers and television networks hired Edison Media Research to conduct exit polls by surveying voters at polling locations nationwide on Election Day (November 6, 2012) in addition to conducting telephone interviews with voters who cast their ballot via absentee ballots or early voting. The respondents included 1,493 voters from Washington state interviewed by landline or cell phone from October 29 through November 4. The survey results included the candidate for whom each voter cast his or her ballot (Barack Obama, Mitt Romney or someone else) and how often the voter attends religious services (weekly, occasionally or never). The results of these two questions for the Washington voters appear in the table below.
Obama Romney other
weekly 163 320 10
occasionally 329 232 6
never 333 82 18
a) How many cases are included in this data set?
b) How many variables are included in this data set?
c) If you randomly select one person from among the voters surveyed, compute the probability that:
i) the person voted for Romney.
ii) the person attends religious services weekly.
iii) the person attends religious services weekly, given that he or she voted for Romney.
iv) the person voted for Romney, given that he or she attends religious services weekly.
v) the person voted for Romney and attends religious services weekly.
vi) the person voted for Romney or attends religious services weekly.
d) Does candidate preference appear to be independent of religiosity? Explain, using conditional probabilities.
23. Religion and politics (again) Refer to the data set from the previous problem.
a) If you randomly select two people from among the voters surveyed, compute the probability that:
i) both people voted for Obama.
ii) neither person never attends religious services.
iii) at least one of them attends religious services occasionally.
iv) one voted for Obama and the other voted for Romney.
b) If you randomly select three people from among the voters surveyed, compute the probability that:
i) all three of them voted from someone other than Obama or Romney.
ii) at least one of them voted from someone other than Obama or Romney.
24. Gubernatorial election In the 2012 Washington state primary election, 46.3% of the voters who participated cast their vote for Jay Inslee, while 43.3% cast their vote for Rob McKenna. The remainder voted for another candidate. A political consultant wanted to randomly select voters from among those who participated in the primary election to interview them about how they planned to vote in the general election.
a) Compute the probability that the first person selected voted for a candidate other than Inslee or McKenna.
b) Compute the probability that the first four people selected voted for a candidate other than Inslee or McKenna.
c) Compute the probability that none of the first four people selected voted for Inslee.
d) Compute the probability that at least one of the first four people selected voted for Inslee.
e) Compute the probability that the first person selected voted for McKenna, given that they voted for one of the top two candidates.
25. Transportation A statistics student wondered whether there might be a relationship between gender and commuting methods among students at Edmonds Community College. He surveyed 200 EdCC students (92 males and 108 females) he happened to encounter around campus, asking each of them about their typical way of commuting to the college. The data from this survey appears below:
male female
car 56 37
bus 30 48
neither 6 23
a) How many cases are included in this data set?
b) How many variables are included in this data set?
c) Was this an observational study or an experiment?
d) What sampling method did this student employ?
e) If you randomly select one of these 200 students, compute the probability that:
i) the student is female.
ii) the student takes the bus to school.
iii) the student takes the bus to school, given that she is female.
iv) the student is female, given that she takes the bus to school.
26. Transportation again Refer to the data set from the previous problem.
a) If you randomly select one of these 200 students, compute the probability that:
i) the student is male.
ii) the student does not take the bus to school.
iii) the student drives a car, given that he is male.
iv) the student drives a car, given that she is female.
v) the student is male, given that he drives a car to school.
b) Is gender independent of transportation method? Explain, using conditional probabilities.
27. More transportation Refer to the data set from the previous two problems.
a) If you randomly select one of the 200 students who participated in the survey, compute the probability that:
i) the person rides the bus to school and is female.
ii) the person rides the bus to school or is female.
b) If you randomly select two of the 200 students who participated in the survey, compute the probability that:
i) both are female.
ii) both ride the bus to school.
iii) at least one rides the bus to school.
iv) neither rides the bus to school.
c) If you randomly select three of the 200 students who participated in the survey, compute the probability that:
i) all three are male.
ii) at least one is male.
iii) at least one drives a car to school.
iv) all of them drive a car to school.
28. [OIS 2.19] Burger preferences A SurveyUSA poll conducted on collected on December 2, 2010, asked 500 Los Angeles residents, "What is the best hamburger place in Southern California? Five Guys Burgers? In-N-Out Burger? Fat Burger? Tommy's Hamburgers? Umami Burger? Or somewhere else?" The distribution of responses by gender appears below.
Gender
Male Female
Five Guys Burgers 5 6
In-N-Out Burger 162 181
Fat Burger 10 12
Tommy’s Hamburgers 27 27
Umami Burger 5 1
Other 26 20
Not Sure 13 5
a) What is the probability that a randomly chosen male likes In-N-Out the best?
b) What is the probability that a randomly chosen female likes In-N-Out the best?
c) What is the probability that a randomly chosen survey respondent likes In-N-Out the best?
d) What is the probability that a randomly chosen survey respondent is male, given that he likes In-N-Out the best?
e) What is the probability that a randomly chosen survey respondent is male or likes In-N-Out the best?
f) What is the probability that a randomly chosen survey respondent is male and likes In-N-Out the best?
29. [OIS 2.20] Assortative mating Assortative mating is a nonrandom mating pattern where individuals with similar genotypes and/or phenotypes mate with one another more frequently than what would be expected under a random mating pattern. Researchers studying this topic (B. Laeng, et al. "Why do blue-eyed men prefer women with the same eye color?" Behavioral Ecology and Sociobiology 61.3 (2007), pp. 371–384) collected data on eye colors of 204 Scandinavian men and their female partners. The table below summarizes the results. (For simplicity, the data only includes heterosexual relationships.)

a) What is the probability that a randomly chosen male respondent or his partner has blue eyes?
b) What is the probability that a randomly chosen male respondent with blue eyes has a partner with blue eyes?
c) What is the probability that a randomly chosen male respondent with brown eyes has a partner with blue eyes?
d) What is the probability of a randomly chosen male respondent with green eyes having a partner with blue eyes?
e) Does it appear that the eye colors of male respondents and their partners are independent? Explain your reasoning.