
Review Problems: Week 1
1. Russell Wilson Sportswriters and football fans have expressed surprise since the Seattle Seahawks named Russell Wilson as their starting quarterback at the beginning of the 2012 season, both because he is a rookie recently drafted after playing college football and because at 5 feet 11 inches he is the shortest starting quarterback in the National Football League. This spreadsheet contains the name, team and height (in feet and inches) or each starting quarterback in the NFL as of September 24, 2012. The data was compiled at my request by my 12-year-old son (and resident sports expert), who reported the source for this data as "Google."
a) How many variables are included in this data set?
b) Classify each variable (categorical, quantitative, etc.) and indicate units for quantitative variables.
c) If this data set had included height data for all of the quarterbacks in the NFL and not just the starting quarterback for each team, would you need to change any part of your response from part b)?
d) How many cases are in this data set?
e) Create an appropriate graphical display of this data.
f) Describe the distribution of heights.
g) Does Russell Wilson appear to be an outlier? Explain.
h) Other sources report Russell Wilson's height more exactly as 5 feet 10 5/8 inches, and yet other sources refer to him as being 5 feet 10 inches tall. If you used 5'10'' for his height, would he appear to be an outlier?
i) Compute the mean, median, standard deviation and IQR for the quarterback heights.
j) Which measure of center is most appropriate for this data set?
k) Which measure of variability is most appropriate for this data set?
2. Exam Scores Below are the midterm exam scores from a statistics class.
100 90 80 73 62 50 17 92 89 74 63 51 93 76
65 52 53 67 98 53 67 98 53 68 99 58 55 58 58
Use these scores to answer the following questions.
a) How many cases are included in this data set?
b) How many variables are included in this data set?
c) Create an appropriate graphical display of the scores.
d) Describe the distribution of the scores.
e) Compute the mean, median, standard deviation and IQR for the exam scores.
f) Which measure of center is most appropriate for this data set?
g) Which measure of variability is most appropriate for this data set?
h) If the student who received a score of 17 dropped the class and was omitted from the data set, what would happen to the:
i) mean score?
ii) median score?
iii) IQR?
iv) standard deviation?
3. Dead Presidents Gerald R. Ford passed away at the age of 93 in 2006. At the time of his death he was the longest-living U.S. president. Find the ages of all 38 deceased presidents (from a reference book or a reliable online source).
a) Create an appropriate graphical display of the ages.
b) Describe the distribution of the ages.
c) Was Gerald Ford unusual?
d) Report an appropriate measure of center and an appropriate measure of variability for the ages.
e) What important variable is not apparent in your graphical display?
4. [OIS 1.37] Histograms and Boxplots Consider the three histograms and three boxplots shown here:

a) Describe the distribution in histogram (a).
b) Describe the distribution in histogram (b).
c) Describe the distribution in histogram (c).
d) Describe the distribution in boxplot (1).
e) Describe the distribution in boxplot (2).
f) Describe the distribution in boxplot (3).
g) Each of the three boxplots graphs the same data as one of the three histograms. Match each histogram with its corresponding boxplot.
h) What (if any) features are apparent in the histograms but not in the boxplots?
i) What (if any) features are apparent in the boxplots but not in the histograms?
j) Estimate the median for the data sets in each of the boxplots.
k) Estimate the IQR for the data sets in each of the boxplots.
l) Estimate the range for the data sets in each of the boxplots.
m) For histogram (c), would the mean be bigger than the median, or smaller? (Or about the same?)
n) For histogram (a), would the mean be bigger than the median, or smaller? (Or about the same?)
5. [OIS 1.38] Air quality Daily air quality is measured by the air quality index (AQI) reported by the Environmental Protection Agency. This index reports the pollution level and what associated health effects might be a concern. The index is calculated for five major air pollutants regulated by the Clean Air Act and takes values from 0 to 300, where a higher value indicates lower air quality. AQI was reported for a sample of 91 days in 2011 in Durham, NC. The relative frequency histogram below shows the distribution of the AQI values on these days.

a) Describe the distribution.
b) Estimate the median AQI.
c) Would you expect the mean to be higher or lower than the median? Explain.
d) Estimate the IQR of the AQI.
6. [CNX 1.15] Distance Learning During the 2010–2011 academic year, 771 distance learning students at Long Beach City College responded to a survey; highlights of the summary report appear in the table below.
| Have computer at home | 96% |
| Unable to come to campus for classes | 65% |
| Age 41 or over | 24% |
| Would like LBCC to offer more DL courses | 95% |
| Took DL classes due to a disability | 17% |
| Live at least 16 miles from campus | 13% |
| Took DL courses to fulfill transfer requirements | 71% |
a) What percentage of the students surveyed live less than 16 miles from campus?
b) About how many students who participated in the survey live at least 16 miles from campus?
c) Would a pie chart be appropriate for this data? Explain.
d) Create an appropriate graphical display of this data.
e) If possible, compute the percentage of students surveyed who are unable to come to campus or live at least 16 miles from campus. (If not, possible explain.)
f) If possible, compute the percentage of students surveyed who are unable to come to campus or took DL courses to fulfill transfer requirements. (If not, possible explain.)
7. Guessing Ages On the first day of the quarter, 37 students in a statistics class took a survey in which they were asked to guess the age of their instructor. These guesses are given below:
47 43 50 38 37 38 37 42 42 41
40 37 35 33 34 45 45 43 38 39
37 32 40 30 32 45 46 35 40 40
33 42 42 40 46 40 35
a) How many cases are in this data set?
b) How many variables are in this data set? (Classify the type of each variable.)
c) Create an appropriate graphical display for this data.
d) Describe the distribution of guesses.
e) Compute the mean, median, standard deviation and IQR for the guesses.
f) Which summary statistics would be most appropriate to summarize the center and variability of the data?
g) If the instructor had asked the students to guess the age of his 5-year-old son, would the standard deviation of guess about his son be smaller or larger than the standard deviation of guesses about the instructor's age?
h) One other student, not listed above, misread the instructions and answered with his or her own age (20) rather than guessing the instructor's age. If this student's response were included in the data set, what would happen to the:
i) mean
ii) median
iii) standard deviation
iv) IQR
8. Presidential Race 2012 Anderson Robbins Research and Shaw & Company Research conducted a poll for Fox News during the period of September 24–26, 2012, asking each respondent, "If the presidential election were held today, how would you vote if the candidates were Democrats Barack Obama and Joe Biden, and Republicans Mitt Romney and Paul Ryan?" If the respondent did not select one of these choices initially, the interviewer followed up with: "Well, which way are you leaning?" Of 1,092 likely voters surveyed nationwide, 48% answered "Obama/Biden" and 43% answered "Romney/Ryan."
a) Based on the information provided above, how many cases are in the data set?
b) How many variables? (Specify a type for each.)
c) Approximately how many of the voters surveyed expressed a preference for Romney and Ryan?
d) Create an appropriate graphical display for this data.
9. Swing States The Marist Poll organization conducted surveys of voters in New Hampshire, Nevada and North Carolina on behalf of NBC News and the Wall Street Journal during the period of September 23–25, 2012. NBC News published an article about the poll results on their Web site, along with PDF documents listing all of the questions asked by the interviewers in each state along with summary statistics for the responses. Download the New Hampshire document and use it to answer the following questions. (The document also contains some information about a previous poll conducted during June 2012; ignore any mention of that earlier poll for the purposes of this exercise.)
a) If possible, determine the number of cases in the New Hampshire data set.
b) List all of the variables in the New Hampshire data set and classify each as categorical, quantitative (be sure to include units), ordinal or identifier.
10. Mac vs. PC A statistics student wondered whether computer shoppers paid more for an Apple computer or a similarly equipped PC. To do this, he searched completed listings for used computers on eBay on December 9, 2009, then randomly selected 11 Apple computers with Intel-based processors. For each of these 11 computers, he examined the configuration (hard drive size, monitor size, CPU speed) and randomly selected a PC with similar configuration. The resulting data set, which included the selling price of an Apple and a PC for 11 different configurations, appears in the following table:
config. Apple PC
A 630 310
B 620 330
C 909 325
D 860 500
E 1359 537
F 899 1099
G 599 475
H 899 394
J 915 389
K 545 422
L 620 585
a) How many cases and variables are represented in this data set? Speciffy the type of each variable (including units for quantitative variables).
b) Construct an appropriate graphical display for the Apple prices and another for the PC prices.
c) Based on your displays, does it appear that computer shoppers pay more for Apple computers or PCs?
d) Compute appropriate summary statistics for the Apple and PC prices.
e) Would it make more sense to compare the Apple prices to the PC prices with two separate displays and sets of summary statistics, or would it make more sense to investigate the price differences for each configuration? Explain.
f) Compute the price differences, create an appropriate graphical display of those differences, and compute appropriate summary statistics.
11. Real Estate Craigslist is a Web site that allows users to post online classified advertisements at no charge (with the exception of job postings in certain metropolitan areas). The table below shows the street address, size (in square feet), asking price (in dollars) and number of bedrooms (abbreviated BR) for nine houses located in the city of Lynnwood listed for sale on Craigslist on October 9, 2011.
address size price BR
18712 57th Ave W 1805 349950 3
19014 24th Ave W 2404 329900 5
3203A 204th St SW 1912 250000 4
17112 6th Ave W 3200 509797 4
19631 9th Pl W 2369 339950 4
17402 62nd Ave W 1200 185000 3
21011 54th Ave W 1660 136950 3
14018 20th Pl W 2244 254950 4
14517 40 Ave W 2450 335000 3
a) How many cases are in this data set?
b) How many variables? List each variable and classify it as categorical, quantitative, ordinal or identifier.
c) Create an appropriate graphical display of the house sizes.
d) Create an appropriate graphical display of the house prices.
e) Compute appropriate summary statistics for the house sizes.
f) Compute appropriate summary statistics for the house prices.
g) If the price of the house on 6th Avenue West was reduced to $499,000, how would that change affect the:
i) mean price?
ii) median price?
iii) IQR?
iv) standard deviation?
v) range?
12. Laundry Detergent An article in the November 2011 issue of Consumer Reports compares the price (in cents per load) and performance (on a scale from 0 to 100) of 34 brands of high-efficiency laundry detergent (used in front-loading machines) and 24 brands of conventional laundry detergent (used in top-loading machines). A graphical display of the price data for the 34 high-efficiency detergents appears below.

a) How many cases are included in the complete data set?
b) List all of the variables included in the complete data set and classify each as categorical, quantitative, ordinal or identifier.
c) What term best describes the graphical display shown above?
d) Describe the describe the distribution of the price variable.
e) Which summary statistics would be most appropriate to report for the price variable?
f) Estimate the median price.
g) Estimate the IQR of the prices.
h) Estimate the range of the prices.
13. Laundry Detergent (Second Load) An article in the November 2011 issue of Consumer Reports compares the price (in cents per load) and performance (on a scale from 0 to 100) of 34 brands of high-efficiency laundry detergent (used in front-loading machines) and 24 brands of conventional laundry detergent (used in top-loading machines). A graphical display of the price data for the 24 conventional detergents appears below.
3|0
2|
2|223
1|556678
1|1123334
0|56789
Key: 3|0 = 30 cents per load
a) What term best describes the graphical display shown above?
b) Describe the describe the distribution of the price variable seen in the graphical display.
c) Compute the median price.
d) Compute the IQR of the prices.
e) Compute the range of the prices.
f) Compute the mean price.
g) Computer the standard deviation of the prices.
h) Which summary statistics would be most appropriate to report for the price variable?
i) Which of the following terms best applies to the detergent that costs 30 cents per load?
14. Exercise A statistics student wondered whether males spend more time exercising on a treadmill at the gym than females. She went to several different gyms on a single day in order to observe 20 males (denoted "m" below) and 20 females ("f") using a treadmill and record the time on the display when they finished running.
52 f 35 f 56 m 25 f
22 m 15 f 41 m 10 f
29 m 38 m 5 m 25 f
55 f 21 m 13 m 48 m
20 f 33 m 48 f 31 m
18 f 10 m 52 m 10 f
5 f 63 m 60 m 60 f
33 m 5 f 40 m 25 f
33 f 26 m 30 m 5 f
30 m 40 f 14 f 35 f
a) How many cases are included in this data set?
b) List the variables included in this data set and classify each as categorical, quantitative, ordinal or identifier.
c) Create an appropriate graphical display for the male running times.
d) Create an appropriate graphical display for the female running times.
e) Describe and compare the distribution for each group.
f) Compute appropriate summary statistics for each group.
15. Coffee An Edmonds Community College student wanted to investigate whether there is a difference in the number of calories between comparable coffee drinks at Starbucks and Seattle's Best Coffee (SBC), two major coffee retailers. She found caloric information about 10 different drinks and created the table shown below:
drink Starbucks SBC
Cappucino 120 130
Latte 190 160
Vanilla Latte 250 240
Iced Latte 130 140
Mocha 260 390
White Chocolate Mocha 400 310
Peppermint Mocha 330 410
Iced Mocha 200 240
Hot Chocolate 300 320
Chai Tea Latte 240 230
a) How many cases are in this data set?
b) List the variables in this data set and classify each as categorical, quantitative, ordinal or identifier.
c) Create appropriate graphical display(s) to help investigate the answer to the student's question and describe the resulting distribution(s).
d) Compute appropriate summary statistics to accompany your graphical display.
e) Do you think there is a significant difference? Explain.
16. Washing Machines The February 2010 issue of Consumer Reports ranked 76 different washing machine models (43 front-loading machines and 33 top-loading machines) based on a variety of considerations. The article included two tables, one for front-loaders and one for top-loaders. Each table listed: the rank of each machine; its make; model; estimated retail price (in dollars); overall Consumer Reports score (on a scale from 0 to 100); test results for washing, energy efficiency, water efficiency, capacity, gentleness, noise and vibration (each rated as Poor, Fair, Good, Very Good or Excellent); and cycle time (in minutes). Data for the first five machines appears below:

a) How many cases were included in the complete data set?
b) List the variables included in the data set, and classify each as categorical, quantitative, ordinal or identifier.
A graphical display of the cycle times for the 33 top-loading machines appears below; use it to answer the next seven questions.

c) What term best describes this type of graphical display?
d) Describe the distribution of cycle times as they appear in the graphical display.
e) What term best applies to the Kenmore Elite Oasis 2808, with a cycle time of 85 minutes?
f) Which measure of center would be more appropriate to report for the cycle time data?
g) Which measure of spread would be more appropriate to report for the cycle time data?
h) Estimate the median cycle time.
i) Would you expect the mean cycle time to be smaller than the median, larger, or about the same?
17. Washing Machines (Second Load) The February 2010 issue of Consumer Reports ranked 76 different washing machine models (43 front-loading machines and 33 top-loading machines) based on a variety of considerations. The article included two tables, one for front-loaders and one for top-loaders. Each table listed: the rank of each machine; its make; model; estimated retail price (in dollars); overall Consumer Reports score (on a scale from 0 to 100); test results for washing, energy efficiency, water efficiency, capacity, gentleness, noise and vibration (each rated as Poor, Fair, Good, Very Good or Excellent); and cycle time (in minutes). The cycle times for the front-loading machines appear below:
80 90 65 55 55 70 55 95 105 70 100 75 55 65 100
85 55 85 70 70 90 70 90 90 60 65 105 60 50 115
70 95 95 70 100 80 95 65 100 65 70 90 100
a) Create an appropriate graphical display for this data.
b) Describe the distribution of cycle times based on your graphical display.
c) Compute the median cycle time.
d) Compute the mean cycle time.
e) Compute the range of cycle times.
f) Compute the IQR of the cycle times.
g) Compute the standard deviation of the cycle times.
h) Do you notice anything unusual about the data values? What might explain this?
18. Toyota Prius The Prius is a popular gas-electric hybrid car manufactured by Toyota. The table below shows the VIN (vehicle identification number), color, age (in years), mileage (in miles) and asking price (in dollars) for 13 used Toyota Prius automobiles advertised for sale on the Web site of The Seattle Times on January 23, 2011.
VIN age color mileage price
JTDKN3DU9A0056349 1 black 9277 28995
JTDKN3DU8A0165157 1 black 4180 28995
JTDKN3DU1A0057303 1 blue 32105 25995
JTDKN3DU9A0147198 1 gray 8129 24995
JTDKB20U197821193 2 pewter 28434 23995
JTDKB20U683348798 3 green 40762 22995
JTDKB20U187716331 3 green 24531 22995
JTDKB20U387727363 3 blue 16262 22995
JTDKN3DU8A0059050 1 silver 32830 21995
JTDKB20U383347267 3 gray 32604 21995
JTDKB20U583417996 3 gray 43827 18995
JTDKB20U697840628 2 white 24632 20995
JTDKB20U297880205 2 white 33651 18680
a) How many cases are in this data set?
b) List the variables and classify each as categorical, quantitative, ordinal or identifier.
c) Construct an appropriate graphical display of the mileage values for these cars.
d) Describe the distribution of mileage values based on your graphical display.
e) Compute the mean mileage.
f) Compute the median mileage.
g) Compute the standard deviation of the mileage values.
h) Compute the IQR of the mileage values.
i) Compute the range of the mileage values.
j) What is the best measure of center to report for mileage?
k) What is the best measure of variability to report for mileage?
l) In addition to the 13 automobiles in the data set provided above, The Seattle Times also listed two significantly older Toyota Prius automobiles:
VIN age color mileage price
JT2BK12U630070267 8 green 83996 10995
JT2BK18U720060613 9 blue 110919 8995
If we included these two cars in the data set,
i) How would that affect the mean?
ii) How would that affect the standard deviation?
m) If you added the 8- and 9-year old cars to the graphical display, what term would best describe them?
19. Hybrid Accord The Accord is a popular model of car manufactured by Honda. During the model years 2005–2007, Honda produced a gas-electric hybrid version of the Accord that boasted slightly better gas mileage than a traditional gasoline-only Accord. The table below shows the model year, color, mileage (in miles) and asking price (in dollars) for all 12 used Honda Accord hybrid automobiles advertised for sale on the Web site of the Los Angeles Times on October 10, 2010.
year color mileage price
2007 desert mist 34525 21995
2006 white pearl 36929 19999
2007 graphite pearl 57706 18888
2007 white pearl 32924 17888
2006 gold 53567 16998
2007 white 47745 15500
2006 gray 86812 13846
2006 gray 76405 12988
2006 white pearl 141700 11490
2005 white 99938 10000
2005 gold 99267 9987
2005 white 134143 8995
a) How many cases are in this data set?
b) List the variables and classify each as categorical, quantitative, ordinal or identifier.
c) Construct an appropriate graphical display of the mileage values for these cars.
d) Describe the distribution of mileage values based on your graphical display.
e) Compute the mean mileage.
f) Compute the median mileage.
g) Compute the standard deviation of the mileage values.
h) Compute the IQR of the mileage values.
i) Compute the range of the mileage values.
j) What is the best measure of center to report for mileage?
k) What is the best measure of variability to report for mileage?
20. Hybrid Accords (Again) Refer the data set from the previous problem.
a) Construct an appropriate graphical display of the prices for these cars.
b) Describe the distribution of prices based on your graphical display.
c) Compute the mean price.
d) Compute the median price.
e) Compute the standard deviation of the prices.
f) Compute the IQR of the prices.
g) Compute the range of the prices.
h) What is the best measure of center to report for price?
i) What is the best measure of variability to report for price?
j) Consider the mileage and price variables in the data set. Does there appear to be some sort of relationship between the mileage of a car and its price? Explain.
k) Do there appear to be any exceptions to this relationship? Explain.
21. Liver disease Between 1974 and 1984, the Mayo Clinic collected information about patients with the liver disease primary biliary cirrhosis (PBC). A study of 216 of these patients with this disease found a mean serum albumin level of 34.46 g/l with a standard deviation of 5.84 g/l. A graphical display of these levels appears below:
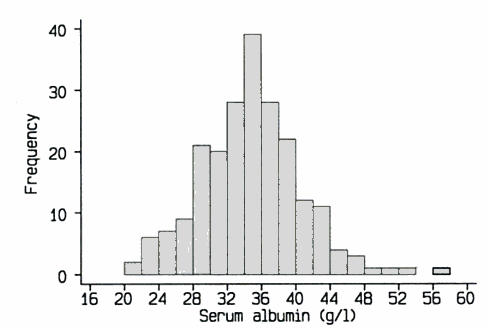
a) What term best describes the graphical display shown above?
b) Describe the shape of the distribution in this graphical display. Be sure to mention any unusual features.
c) Would it be more appropriate to report the mean or the median for this data set? Explain.
d) Would it be more appropriate to report the range, standard deviation or IQR for this data set? Explain.
e) Approximately what percentage of people involved in this study has a serum albumin level below 28 g/l?
f) Estimate the median serum albumin level for these 216 patients.
g) Estimate the range of the serum albumin levels for these 216 patients.
h) Estimate the IQR of the serum albumin levels for these 216 patients.
i) Would you expect the mean serum albumin level for these 216 patients to be greater than, less than or about the same as the median?
j) Would it be appropriate to use a stem-and-leaf display to graph this data? Explain.
22. Left-hand turns On December 2, 2009, a statistics student observed traffic near the corner of 148th and Manor Way in Lynnwood, to investigate whether there is a difference in the duration of time taken to make a left-hand turn between male and female drivers. For 30 drivers (15 male and 15 female), she used a stopwatch to record the gender of each driver and the length of time used to make a left-hand turn. The data she recorded appears below:
male 4.0 3.4 4.3 3.6 2.7 3.8 4.3 3.5 5.3 4.6 3.9 5.1 5.0 4.1 4.8
female 4.7 5.3 5.4 4.1 4.7 3.8 3.1 4.2 4.1 2.9 4.1 4.2 3.7 4.0 4.0
a) How many cases are included in this data set?
b) How many variables are included in this data set?
c) Create a graphical display of the turning times for the male drivers.
d) Describe the distribution of turning times for the male drivers. Be sure to mention any unusual features.
e) Compute the mean turning time for the male drivers.
f) Compute the median turning time for the male drivers.
g) Is it more appropriate to report the mean or the median for the male drivers? Explain.
h) Compute the range of the turning times for the male drivers.
i) Compute the IQR of the turning times for the male drivers.
j) Compute the standard deviation of the turning times for the male drivers.
k) Is it more appropriate to report the range, IQR or standard deviation for the male drivers? Explain.
23. More turns Refer to the previous exercise.
a) Create a graphical display of the turning times for the female drivers.
b) Describe the distribution of turning times for the female drivers. Be sure to mention any unusual features.
c) Compute the mean turning time for the female drivers.
d) Compute the median turning time for the female drivers.
e) Is it more appropriate to report the mean or the median for the female drivers? Explain.
f) Compute the range of the turning times for the female drivers.
g) Compute the IQR of the turning times for the female drivers.
h) Compute the standard deviation of the turning times for the female drivers.
i) Is it more appropriate to report the range, IQR or standard deviation for the female drivers? Explain.
24. Nerf guns For a class project, a statistics student tested his theory about the regulators found on Nerf guns: that they slow the muzzle velocity of the darts. He collected three Nerf guns that had 22 barrels among them, each barrel individually regulated. He fired a Nerf dart once using each barrel and measured how many inches it traveled, using the same dart on all tests. He then removed the regulators and fired one shot with each of the barrels again. The data he recorded appears below:
barrel regulator no regulator
1 231 252
2 208 245
3 202 251
4 212 265
5 193 210
6 201 234
7 125 155
8 168 141
9 38 74
10 154 231
11 122 103
12 77 123
13 243 262
14 215 252
15 239 221
16 234 268
17 232 245
18 237 252
19 230 254
20 245 259
21 218 249
22 246 262
a) How many variables are included in this data set? (Specify the variables and classify each.)
b) How many cases are included in this data set?
c) Create a graphical display for the distances resulting from firing the gun with a regulator.
d) Describe the distribution of distances resulting from firing the gun with a regulator. Be sure to mention any unusual features.
e) Compute the mean distance for the firings with a regulator.
f) Compute the median distance for the firings with a regulator.
g) Is it more appropriate to report the mean or the median for the firings with a regulator? Explain.
h) Compute the range of the distances for the firings with a regulator.
i) Compute the IQR of the distances for the firings with a regulator.
j) Compute the standard deviation of the distances for the firings with a regulator.
k) Is it more appropriate to report the range, IQR or standard deviation for distances for the firings with a regulator? Explain.
25. Nerf II Refer to the data set from the previous problem.
a) Create a graphical display for the distances resulting from firing the gun without a regulator.
b) Describe the distribution of distances resulting from firing the gun without a regulator. Be sure to mention any unusual features.
c) Compute the mean distance for the firings without a regulator.
d) Compute the median distance for the firings without a regulator.
e) Is it more appropriate to report the mean or the median for the firings without a regulator? Explain.
f) Compute the range of the distances for the firings without a regulator.
g) Compute the IQR of the distances for the firings without a regulator.
h) Compute the standard deviation of the distances for the firings without a regulator.
i) Is it more appropriate to report the range, IQR or standard deviation for distances for the firings without a regulator? Explain.
26. Inkjet printers For their May 2005 issue, the editors of Consumer Reports compared the cost and effectiveness of a variety of inkjet printers. The following table lists the model, retail price (in dollars) and the text speed (in pages per minute, or ppm) for the 13 top-ranked models.
model price speed
HP Deskjet 6540 130 11.0
Canon Pixma iP4000 140 10.0
HP PhotoSmart 7760 150 6.0
HP Deskjet 5850 235 6.0
HP PhotoSmart 7960 230 6.0
HP PhotoSmart 8450 245 7.0
Canon Pixma iP5000 190 9.0
Canon Pixma iP2000 80 10.0
Canon Pixma iP8500 345 4.5
HP Deskjet 6127 250 7.0
Lexmark P915 Photo 135 9.0
Epson Stylus Photo R800 375 2.5
Lexmark Color Jetprinter Z816 90 9.5
a) How many cases are included in this data set?
b) How many variables are included in this data set?
c) Classify each variable as quantitative, categorical ordinal or identifier.
d) Construct an appropriate graphical display for the prices of these 13 printers.
e) Compute the mean price for these 13 printers.
f) Compute the median price for these 13 printers.
g) Compute the IQR of the prices for these 13 printers.
h) Compute the standard deviation of the prices for these 13 printers.
i) Compute the range of the prices for these 13 printers.
j) Which measurement of center should you report for the prices of these 13 printers: mean or median? Explain.
k) Which measurement of variation should you report for the prices of these 13 printers: standard deviation, IQR or range? Explain.
27. Printers again Refer to the data from the previous exercise.
a) Construct an appropriate graphical display for the speeds of these 13 printers.
b) Compute the mean speed for these 13 printers.
c) Compute the median speed for these 13 printers.
d) Compute the IQR of the speeds for these 13 printers.
e) Compute the standard deviation of the speeds for these 13 printers.
f) Compute the range of the speeds for these 13 printers.
g) Which measurement of center should you report for the speeds of these 13 printers: mean or median? Explain.
h) Which measurement of variation should you report for the speeds of these 13 printers: standard deviation, IQR or range? Explain.
28. James Bond The following information about the 23 James Bond films produced by Eon Productions over the past 50 years appears in the table below: production order; year of release; total box office gross (in millions of US dollars); budget (in millions of U.S. dollars); adjusted box office gross (in millions of US dollars, adjusted to the 2008 Consumer Price Index); and the duration (in seconds) of the title song for each film. The information comes from Wikipedia and Amazon.com (for the song duration).
no title year gross budget adj BO song
1 Dr. No 1962 59.6 1.2 425.5 107
2 From Russia With Love 1963 78.9 2.5 555.9 153
3 Goldfinger 1964 124.9 3.5 868.7 168
4 Thunderball 1965 141.2 11.0 966.4 182
5 You Only Live Twice 1967 111.6 9.5 720.4 165
6 On Her Majesty's Secret Service 1969 87.4 7.0 513.4 193
7 Diamonds Are Forever 1971 116.0 7.2 617.5 161
8 Live and Let Die 1973 161.8 12.0 785.7 193
9 The Man With the Golden Gun 1974 97.6 13.0 426.8 154
10 The Spy Who Loved Me 1977 187.3 28.0 666.4 208
11 Moonraker 1979 210.3 34.0 624.5 188
12 For Your Eyes Only 1981 202.8 28.0 481.0 183
13 Octopussy 1983 187.5 27.5 405.9 182
14 A View to a Kill 1985 157.8 30.0 316.2 214
15 The Living Daylights 1987 191.2 40.0 362.9 283
16 Licence to Kill 1989 156.2 32.0 271.6 251
17 GoldenEye 1995 353.4 60.0 500.0 209
18 Tomorrow Never Dies 1997 346.6 110.0 465.6 292
19 The World Is Not Enough 1999 390.0 135.0 504.7 237
20 Die Another Day 2002 456.0 142.0 546.5 276
21 Casino Royale 2006 599.2 150.0 640.8 241
22 Quantum of Solace 2008 586.1 230.0 586.1 263
23 Skyfall 2012 ? 150.0 ? 286
a) How many cases are included in this data set?
b) How many variables are included in this data set?
c) List each variable and classify it according to type (categorical, ordinal, quantitative, identifier). Be sure to include units for quantitative variables.
d) Create an appropriate graphical display for the song duration variable.
e) Describe the distribution of song durations.
f) Compute the mean song duration.
g) Compute the median song duration.
h) Which would be more appropriate to report: mean or median? Explain.
i) Compute the standard deviation of the song durations.
j) Compute the IQR of the song durations.
k) Compute the range of the song durations.
l) Which would be most appropriate to report: standard deviation, IQR or range? Explain.
29. James Bond will return Refer to the data set from the previous problem.
a) Create an appropriate graphical display for total box office gross. (You'll need to omit Skyfall, which premiered in the USA on November 9, 2012.)
b) Describe the distribution you see in this display.
c) Compute the mean box office gross.
d) Compute the median box office gross.
e) Which would be more appropriate to report: mean or median? Explain.
f) Compute the standard deviation of the box office grosses.
g) Compute the IQR of the box office grosses.
h) Compute the range of the box office grosses.
i) Which would be most appropriate to report: standard deviation, IQR or range? Explain.
j) Look up the current box office gross for Skyfall (which is still playing in theaters). If you included Skyfall in the data set,
i) Would it be an outlier? Explain.
ii) Would the mean increase, decrease or stay about the same?
ii) Would the median increase, decrease or stay about the same?
iii) Would the standard deviation increase, decrease or stay about the same?
iv) Would the IQR increase, decrease or stay about the same?
v) Would the range increase, decrease or stay about the same?