
Normal Approximation to the Binomial
Various polls conducted in late January 2007 reported that about 35% of registered voters supported President Bush's plan to send additional troops to Iraq. Suppose we wanted to ask these voters more detailed questions about the reasons they support the troop surge. We randomly select 1000 voters registered for our follow-up survey.
Let `X` represent the number of voters (out of the 1000 we contact) who approve of the troop surge. Let's check that a binomial model applies to this random variable:
Two outcomes: Either the voter answers "yes, I support the troop surge" or they do not; if they do not answer "yes" they might say "no, I do not support the troop surge" or "I don't know" or "I have no opinion" but we will classify all such responses as failures and we will consider a voter who answers "yes" as a success.
Constant probability of success: We are assuming that 35% of all registered voters support the troop surge. Since we are only sampling 1000 voters out of more than 100,000,000, the probability of success should not substantially change as we remove voters from the general population into our sample.
Independent trials: Since we are selecting the voters at random, their opinions about the troop surge should be independent of one another.
Suppose we want to get at least 400 voters who support the troop surge for our follow-up survey. What is the probability that our sample of 1000 randomly selected voters will contain at least 400 people who support the troop surge?
Since a binomial model applies, we can compute:
`P(X geq 400)` = 1−binomcdf(1000,0.35,399) ≈ 0.00057 = 0.057%
so it is very unlikely that we will get enough voters in our sample who support the troop surge. We should plan to contact more than 1000 voters for our follow-up survey.
We've answered the question at hand, but there's another way to solve this problem that will be useful in future applications, so we employ it now to show that it gives (approximately) the same answer as our first method.
If we look at graphs of the binomial probabilities with p = 0.35 and n = 5, n = 10, n = 25 and n = 100, we see:
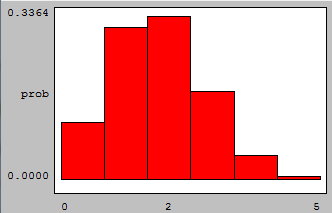
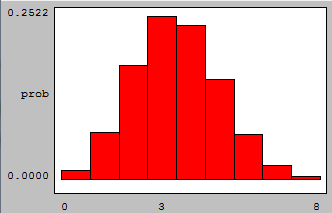
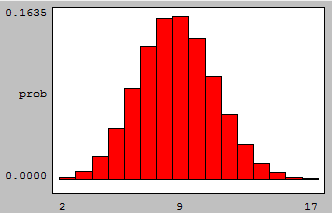
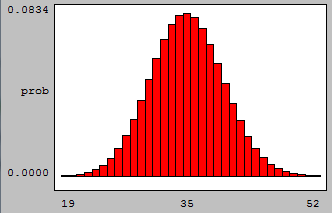
we see that the binomial model begins to look very much like the Normal model as n increases.
In fact, when `np geq 10` and `nq geq 10` we can approximate the binomial model quite well using a Normal model. (For the details, see the discussion following the exercises.)
In our present example we have `p = 0.35` so:
`np = 1000*0.35 = 350 geq 10`
and:
`nq = 1000*0.65 = 650 geq 10`
so this condition is certainly satisfied.
Of course, in order to use a Normal model we need to specify the mean and standard deviation. For our present example, the mean is:
`mu = np = 1000*0.35 =350`
and the standard deviation is:
`sigma = sqrt(npq) = sqrt(1000*0.35*0.65) approx 15.08`.
Thus we want to use the Normal model N(350,15.08). To compute `P(X geq 400)` we compute:
normalcdf(400,1E99,350,15.08) ≈ 0.00046
Notice that this isn't equal to the exact answer we got with 1−binomcdf(1000,0.35,399), but it's fairly close (in fact, close enough to reach the same conclusion that we will need to survey more than 1000 voters).
We can sometimes get a more accurate answer if we realize that our random variable `X` is discrete: it might equal 398, or 399, or 400, or 401, but it can't equal 399.8; thus, any number between 399.5 and 400.5 would be interpreted as being equal to 400. So we adjust our computation slightly and use:
`P(X geq 400)` ≈ normalcdf(399.5,1E99,350,15.08) ≈ 0.00051,
which is closer (although still not equal to the exact answer). This adjustment is called a continuity correction; while you're welcome to use it, our Normal model approximations will usually be good enough without it. Just keep in mind that the Normal model only gives us an approximation to the binomial model.
Exercises
1. According to the U.S. Census Bureau, 23.2% of Washington state residents are under 18 years old. We want to randomly select 100 Washington residents for a survey.
a) Explain why a binomial model would be appropriate to model the number of residents under 18 in a 100-person random sample.
b) Using binomial probability techniques, compute the probability that more than 1/4 of the 100 residents selected are under age 18.
c) Explain why a Normal approximation to the binomial would be appropriate in this situation.
d) Use Normal model techniques to compute the probability that more than 1/4 of the 100 residents selected are under age 18.
2. According to the U.S. Census Bureau, 6.5% of Washington state residents are under 5 years old. We want to randomly select 100 Washington residents for a survey.
a) Explain why a binomial model would be appropriate to model the number of residents under 5 in a 100-person random sample.
b) Using binomial probability techniques, compute the probability that more than 10% of the 100 residents selected are under age 5.
c) Would a Normal approximation to the binomial be appropriate in this situation? If so, compute the probability that more than 10% of the 100 residents selected are under age 5; if not, explain.
d) Would a Normal approximation to the binomial be appropriate in this situation if we selected 500 residents? If so, compute the probability that more than 10% of the 500 residents selected are under age 5; if not, explain.