
Computing z-scores
The histogram below shows the distribution of mean commuting times (in minutes) for 3,143 U.S. counties during 2010.

The mean of these (mean) travel times is 22.7 minutes, with a standard deviation of 5.5 minutes.
The next histogram
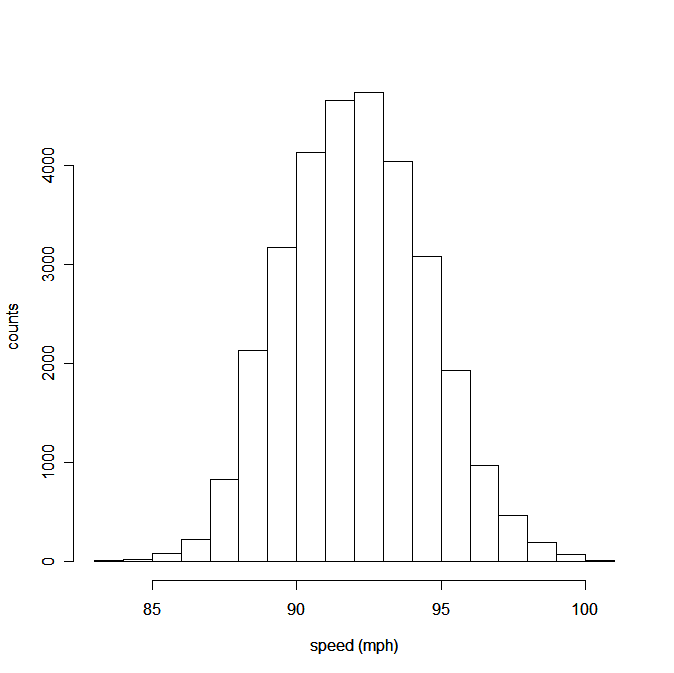
displays the speeds for all 30,740 four-seam fastballs thrown by 20 starting pitchers during the 2009 Major League Baseball season. The mean speed was 92.12 mph, with a standard deviation of 2.43 mph.
Notice that both of these displays are roughly unimodal and symmetric, although they have different centers and spreads. It might be a strange question, but we could ask: "Which is more unusual, a county with a mean commute time of 35 minutes, or a 97-mph four-seam fastball?
One way to answer this question might be to see how much each situation deviates from the mean. A county with a 35-minute mean commute time would be 35−22.7 = 12.3 minutes above average, while a 97 mph four-seam fastball would be 97−92.12 = 4.88 mph above average. But how could we compare minutes to mph?
The standard deviation of travel times is 5.5 minutes, so a deviation of 12.3 minutes would be 12.3/5.5 ≈ 2.24 standard deviations above the mean.
Likewise, the standard deviation of four-seam fastball speeds is 2.43 mph, so a deviation of 4.88 mph would be 4.88/2.43 ≈ 2.01 standard deviations above the mean.
According to these computations, a county with a mean commute time of 35 minutes would be more unusual, because it is further away from the average mean commute time than a 97 mph pitch is away from the average speed of a four-seam fastball.
We define this measurement in terms of standard deviations away from the mean as the z-score of a data value. If we know then population mean (μ) and population standard deviation (σ), as we do here (because we have data about all of the counties in the U.S. and all of the pitches thrown by the 20 pitchers), we can express this as a formula:
`z = (x - mu)/(sigma)`
where x represents an individual data value.
For sample data, where we know the sample mean (`bar(x)` ) and sample standard deviation (s), the formula is:
`z = (x - bar(x))/(s)`
Because we typically report mean and standard deviation only when the data set is roughly unimodal and symmetric, we usually only compute z-scores for data values in such data sets.
Exercises
1. Commute times Compute the z-score for each of the following counties, whose mean commute times are given below.
a) Snohomish County, WA: 29.7 minutes
b) Whitman County, WA: 14.5 minutes
c) Robertson County, KY: 44.2 minutes
d) King County, TX: 4.5 minutes
2. More commuting What can you say about the mean commute time for each of the following counties, given its z-score?
a) King County, WA: z = 0.71
b) Kalawao County, HI: z = -3