
Two Categorical Variables
We previously considered an example about a survey administered to 41 statistics students. Each student reported his or her gender, along with whether he or she preferred Coke-brand beverages, Pepsi-brand beverages, or neither. For reference, here is that data set:
| gender | beverage |
| female | coke |
| female | coke |
| female | coke |
| female | coke |
| female | coke |
| female | coke |
| female | coke |
| female | pepsi |
| female | pepsi |
| female | pepsi |
| female | pepsi |
| female | pepsi |
| female | pepsi |
| female | pepsi |
| female | pepsi |
| female | pepsi |
| female | pepsi |
| female | neither |
| female | neither |
| female | neither |
| female | neither |
| female | neither |
| female | neither |
| female | neither |
| female | neither |
| male | coke |
| male | coke |
| male | coke |
| male | coke |
| male | coke |
| male | coke |
| male | coke |
| male | coke |
| male | coke |
| male | pepsi |
| male | pepsi |
| male | pepsi |
| male | pepsi |
| male | neither |
| male | neither |
| male | neither |
Let's investigate whether there might be a relationship between these two categorical variables (gender and beverage). We might ask the question, "Are the beverage preferences the same for males and females?" Or, in other words, "Is beverage preference independent of gender?"
One way to investigate this question is to create a two-way table:
| female | male | |
| Coke | 7 | 9 |
| Pepsi | 10 | 4 |
| neither | 8 | 3 |
Note that each category of the beverage variable gets its own row, and each category of the gender variable gets its own column. This particular two-way table is a special type of two-way table called a contingency table: it is the result of surveying a single group (the 41 statistics students) and classifying them according to two variables (gender and beverage). If we had considered two or more groups (say students in a statistics class, students in a calculus class and students in a differential equations class) and classified them according to a single variable (beverage preference) then we would have a two-way table but not a contingency table. (This difference is a subtle one, to be sure, but will become important later in the course.)
What does the data tell us in contingency table form that we couldn't see before? It appears that males are more likely to prefer Coke and females more likely to prefer Pepsi or "neither." But is this difference significant? In other words, are the differences between males and females in this sample big enough to convince us that there really is a difference in beverage preferences between all males and females? Or could male and female beverage preferences be about the same, but we just happened to get a class with fewer male Pepsi drinkers than we would otherwise expect? This is a key question that we will spend most of this course developing techniques to answer systematically.
Often it is helpful to include subtotals for each row and column, as follows:
| female | male | total | |
| Coke | 7 | 9 | 16 |
| Pepsi | 10 | 4 | 14 |
| neither | 8 | 3 | 11 |
| total | 25 | 16 | 41 |
Notice that the subtotals in the rightmost column are the same as in the frequency table for the beverage variable we constructed earlier; this is called a marginal distribution of the beverage variable (because it occurs in the margin of the table). The marginal distribution of the gender variable can be found in the bottom row of the table. Note that the subtotals for the beverage categories sum to 41 (the total number of cases), as do the subtotals for the gender categories. The subtotals allow us to compute relevant percentages more easily. For example:
What percentage of males perfer Pepsi? 4/16 = 25%
What percentage of Pepsi drinkers are male? 4/14 ≈ 28.6%
We could also isolate the Pepsi drinkers:
| female | male | total | |
| Pepsi | 10 | 4 | 14 |
or the males:
| male | |
| Coke | 9 |
| Pepsi | 4 |
| neither | 3 |
| total | 16 |
In each of these cases we call the isolated row or column a conditional distribution (because we attach a condition to the data, as in "if we only consider Pepsi drinkers…"). The first of these (with the Pepsi drinkers isolated) is the distribution of the gender variable under the condition that we only look at the Pepsi drinkers; the second is the distribution of beverage preference under the condition that the students are male.
Counts vs. percentages
Now look back at our original contingency table:
| female | male | total | |
| Coke | 7 | 9 | 16 |
| Pepsi | 10 | 4 | 14 |
| neither | 8 | 3 | 11 |
| total | 25 | 16 | 41 |
One thing preventing us from easily comparing males to females is the fact that there are 25 females in the class but only 16 males. We can see there are more female students who prefer Pepsi than male students, but is that merely due to the fact that there are more females in the class? To better compare males to females we can look at percentages instead of counts. Noticing that there are 25 females in the class, we can compute that 7/25 = 28% prefer Coke, while 10/25 = 40% prefer Pepsi and 8/25 = 32% prefer neither; likewise, among the males, 9/16 ≈ 56% prefer Coke, while 4/16 = 25% prefer Pepsi and 3/16 ≈ 19% prefer neither. Replacing the counts in the original two-way table with these percentages, we have:
| female | male | |
| Coke | 28% | 56% |
| Pepsi | 40% | 25% |
| neither | 32% | 19% |
| total | 100% | 100% |
The female percentages are quite different from the male percentages. Because of this, we say that there is evidence that gender and beverage preference are not independent.
Notice the phrase "There is evidence…" in this statement; we aren't absolutely sure this is true (and other groups of students may yield different results) but the evidence we have indicates there might be some association between gender and beverage preference.
Note also that we say these two variables are "not independent" rather than saying they are "dependent"; the word "dependent" implies that one variable depends on the other, or in other words that there is a cause-and-effect relationship between the two variables. This may not be true. In fact, it is quite unlikely that being female causes you to prefer Pepsi (it's more likely that certain soft drink companies target males or females in their advertising) and it's extremely unlikely that drinking Coke or Pepsi causes you to become male or female! We can say "there is an association" between the two variables or that the variables are "not independent" but we should not use the word "dependent" here.
Mosaic plots
When we examined one categorical variable, we worked both with summary statistics (counts and percentages in a frequency table) and graphical displays (bar charts). So far we've used a two-way table (with counts or percentages) to summarize the relationship between two categorical variables, but we'll want to create a graphical display in this situation as well.
We begin with a square:

For the purposes of this discussion, let's assume that the dimensions of the square are 100 mm by 100 mm. Now let's split the square into males and females. Because 25/41 ≈ 61% of the class is female (so that 39% is male), we'll split the square into pieces that are 61 mm wide and 39 mm wide:

Now, let's split the female rectangle on the left into pieces that are 28 mm high, 40 mm high and 32 mm high to represent the percentages of females who prefer Coke, Pepsi or neither, respectively. We'll color-code these using red for Coke, blue for Pepsi and gray for neither:

Likewise, let's split the male rectangle on the right into pieces that are 56 mm high, 25 mm high and 19 mm high, using the same color-coding:

Finally, we can add some labels:

We call the resulting display a mosaic plot. These aren't hard to draw by hand using graph paper and a ruler, but various computer programs can also create mosaic plots; here's one with the results of a similar survey from a different statistics class:
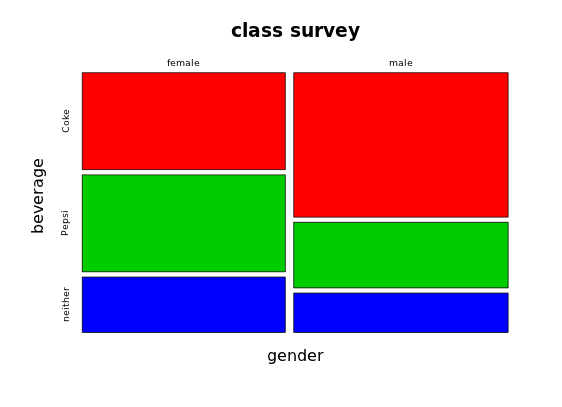
Generally, we don't expect the male and female rectangles to be the same width, because there's no reason to think that there would be an equal number of males and females in the class. But if gender and beverage preference were independent (in other words, if there were no association between gender and beverage preference) we would expect the heights of the Coke, Pepsi and neither rectangles to be roughly the same for the males as they are for the females. This is obviously not the case (for either of the two mosaic plots), so we conclude that "there is evidence that gender and beverage preference are not independent." (We could also say that "there is evidence of an association between gender and beverage preference.")
Exercises
1. [OIS 1.48] Views on immigration A SurveyUSA poll conducted January 27–29, 2012, interviewed 910 registered voters from Tampa, Florida, asking each respondent if they thought workers who have illegally entered the US should be (i) allowed to keep their jobs and apply for US citizenship, (ii) allowed to keep their jobs as temporary guest workers but not allowed to apply for US citizenship, or (iii) lose their jobs and be required to leave the country. The survey also asked each respondent to characterize their political ideology (conservative, moderate, liberal). The results of this survey appear in the table below:
political ideology
Conservative Moderate Liberal
(i) Apply for citizenship 57 120 101
immigration (ii) Guest worker 121 113 28
response (iii) Leave the country 179 126 45
(iv) Not sure 15 4 1
a) How many cases are included in this data set?
b) How many variables are included in this data set?
c) What percentage of the voters surveyed identified themselves as conservatives?
d) What percentage favored the citizenship option?
e) What percentage of these voters identified themselves as conservatives and favored the citizenship option?
f) What percentage of voters who favored the citizenship option identified themselves as conservative?
g) What percentage of conservative voters favored the citizenship option?
h) What percentage of moderates favored the citizenship option?
i) What percentage of liberals favored the citizenship option?
j) Create an appropriate graphical display of the data given in the table.
k) Do political ideology and views on immigration appear to be independent? Explain.
2. [OIS 1.49] Views on the DREAM Act The SurveyUSA poll mentioned in the previous exercise also asked respondents if they supported the DREAM Act, a proposed law that would provide a path to citizenship for people brought illegally to the US as children. Based on the mosaic plot shown below, are views on the DREAM Act and political ideology independent?
