
Summarizing and Displaying Categorical Data
On September 18, 2006, I administered a survey to a statistics class at Edmonds Community College. The survey asked several questions, among them the gender of the student (male or female) and whether each student preferred Coke-brand beverages, Pepsi-brand beverages, or neither. Here is the data set:
| gender | beverage |
| female | coke |
| female | coke |
| female | coke |
| female | coke |
| female | coke |
| female | coke |
| female | coke |
| female | pepsi |
| female | pepsi |
| female | pepsi |
| female | pepsi |
| female | pepsi |
| female | pepsi |
| female | pepsi |
| female | pepsi |
| female | pepsi |
| female | pepsi |
| female | neither |
| female | neither |
| female | neither |
| female | neither |
| female | neither |
| female | neither |
| female | neither |
| female | neither |
| male | coke |
| male | coke |
| male | coke |
| male | coke |
| male | coke |
| male | coke |
| male | coke |
| male | coke |
| male | coke |
| male | pepsi |
| male | pepsi |
| male | pepsi |
| male | pepsi |
| male | neither |
| male | neither |
| male | neither |
The data set includes 41 cases and two variables (gender and beverage preference, both categorical). Let's investigate the beverage preference of these 41 students.
To summarize the results of this survey, we can count that 16 students preferred Coke and 14 preferred Pepsi, while 11 preferred "neither." Collecting this information into a table:
| beverage | count |
| Coke | 16 |
| Pepsi | 14 |
| neither | 11 |
Such a table is called a frequency table, because it indicates how frequently each of the three possible responses occurs. The counts found in the second column are summary statistics for the (categorical) beverage variable.
We might also want to display this information graphically. Placing a tally mark (|) for each student next to the corresponding value of the beverage variable, we get:
| Coke | |||||||||||||||| |
| Pepsi | |||||||||||||| |
| neither | ||||||||||| |
(You can find the | symbol above the ENTER key on most keyboards.) We could use a different symbol, like X or o:
| Coke | oooooooooooooooo |
| Pepsi | oooooooooooooo |
| neither | ooooooooooo |
but | takes up less space in most fonts. For larger data sets, we might need to let each | symbol correspond to 10 or 100 cases. Alternatively, we could use a rectangular bar in place of the individual symbols:

We call such a display a bar chart. It's not difficult to make a bar chart by hand,
especially with the aid of some graph paper:

Notice that we label each bar to indicate the category it represents, and also notice that the bars can extend either vertically or horizontally.
Counts vs. percentages
It can also be useful (especially when the counts are very large) to summarize and display information about a categorical variable using percentages (or, to use fancier statistics terminology, relative frequencies or proportions) rather than counts.
For the beverage data, 16 of the 41 students preferred Coke, so we can compute that 16/41 ≈ 0.39 = 39% of the students surveyed preferred Coke. Likewise, 34% preferred Pepsi and the remaining 27% responded "neither." Creating a bar chart using these percentages we get:
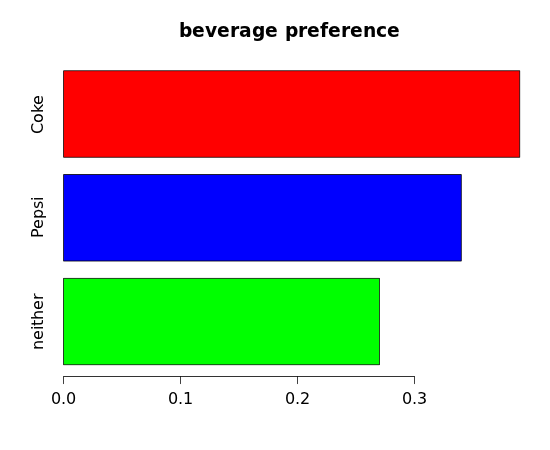
You'll notice that this looks remarkably similar to the previous bar chart: whether we use counts or percentages, the picture remains the same, only the scale differs.
If the percentages sum to 100% (in other words, they represent parts of a whole), we can also create a pie chart:
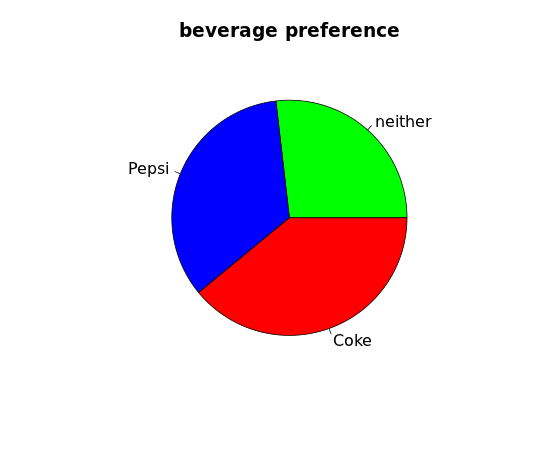
Pie charts are more difficult to draw accurately "by hand" (unless you happen to have a compass and protractor) and they have other drawbacks as well. Notice that in the pie chart it is very difficult to tell whether more students prefer Coke or Pepsi, while in the bar chart we can easily see that Coke is preferred (slightly) more than Pepsi among these 41 students. Although pie charts are ubiquitous in print and online, statisticians prefer not to use them.
Exercises
1. (OIS* 1.47) Antibiotic use in children. The bar chart and pie chart below display the distribution of pre-existing medical conditions among children involved in a study on the optimal duration of antibiotic use for treatment of tracheitis (an upper respiratory infection).

a) What features are apparent in the bar chart but not in the pie chart?
b) What features are apparent in the pie chart but not in the bar chart?
c) How many variables are displayed in the bar chart?
d) What is the most common pre-existing condition among these children?
e) What is the second most common condition?
f) Is it easier to answer part e) by examining the bar chart or the pie chart?
g) Might it be possible for a child to have more than one pre-existing condition?
h) Does that appear to be the situation here?
i) If children could have more than one pre-existing condition, would it still be appropriate to use a bar chart?
j) If children could have more than one pre-existing condition, would it still be appropriate to use a pie chart?
k) Approximately what percentage of these children have a neuromuscular condition?
l) Is it easier to answer part k) by examining the bar chart or the pie chart?
*OIS indicates this problem is adapted from OpenIntro Statistics, an open source textbook you can download for free as a PDF file or purchase on Amazon.com for under $10.
2. Of the 100 senators in the United States Senate, 20 are women (according to Wikipedia) as of January 3, 2012. Create an appropriate graphical display using this data.
3. A poll of 524 Washington voters conducted September 7–9, 2012, by SurveyUSA found that 57% of those surveyed supported a ballot initiative to legalize the sale of marijuana, while 32% planned to vote against it, with the rest undecided. Create an appropriate graphical display of this data.